
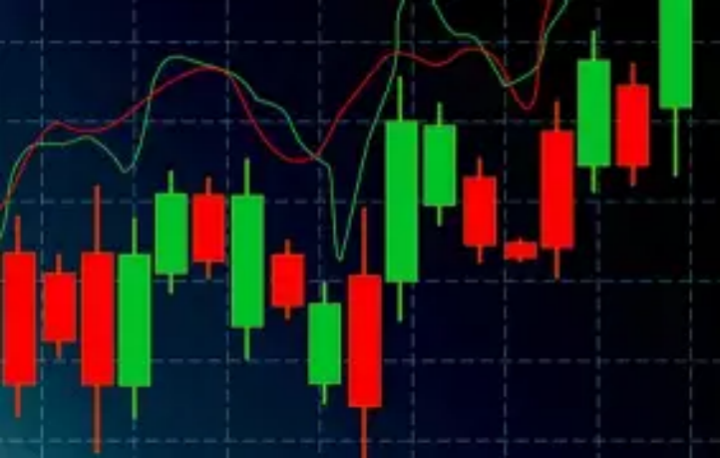
For both experienced investors and wealthy traders, K-line charts may seem like simple technical data—rows of green and red candles showing price changes. However, within these visual designs, there is an unseen story: the shared mindset of those in the market. For wealthy individuals exploring financial markets, understanding this psychological background is not merely an advantage; it is essential for identifying significant trends amid the market's distractions.
Emotional Signatures in Candlestick Patterns
Each candlestick pattern shows how people feel as a group. A tall green candle that ends close to its peak represents the joy and success of buyers, whereas a red candle with a long upper shadow shows uncertainty—initial hope turning into skepticism. For wealthy investors, formations such as "double tops" suggest more than just a point of resistance; they highlight mental barriers where losing buyer confidence indicates a change in feelings from assurance to doubt.
Cognitive Biases Shaping Trends
Market trends often continue because of deep-seated cognitive biases. Investors, driven by confirmation bias, search for information that supports their beliefs and tend to overlook caution signs, which boosts momentum. Wealthy people frequently become overconfident, wrongly believing that random K-line pattern changes are significant signals. Interestingly, small-bodied candles paired with long shadows may not suggest uncertainty; instead, they could reveal that major players are strategically building up positions, taking advantage of how people misread unclear signals.
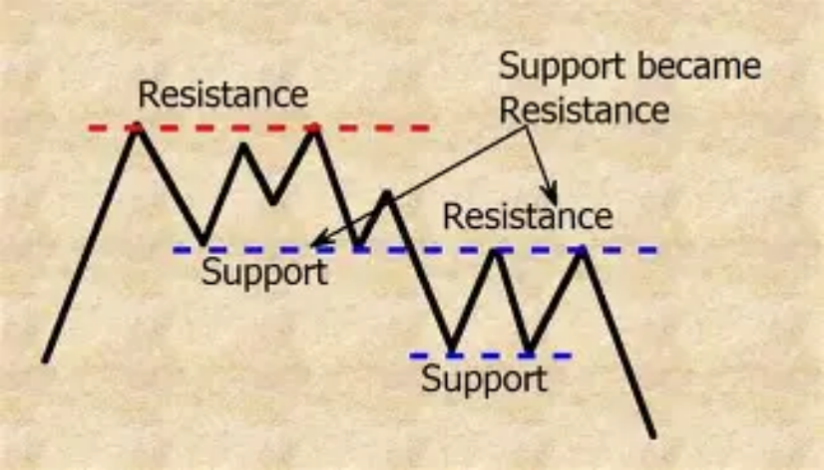
Psychology Behind Support and Resistance
Support and resistance levels function as psychological zones rather than mere mathematical points. When prices hit support, buyers are influenced by the past and think, "It has rebounded here previously, so it's priced low." On the other hand, resistance levels stir up selling urges due to previous unsuccessful attempts to move higher. A price move above resistance signifies a change in thinking—from viewing it as "too costly" to seeing it as "more valuable." Understanding this shift before prices fully adjust distinguishes those who follow trends from those who predict them, showcasing how collective stories shape market perceptions of value.
Emotional Cycles Preceding Market Turns
Market peaks and valleys are primarily influenced by psychology. The "M head" patterns form when confidence turns into uncertainty, leading to denial as latecomers try to capitalize on last-minute profits. Conversely, "W bottoms" illustrate the transformation from hopelessness to cautious optimism as selling pressure diminishes. Wealthy investors who understand this timing skillfully avoid buying at peaks or selling at lows. A long-legged doji, where the opening and closing prices are close together, indicates an important emotional change, suggesting a shift in the balance between buyers and sellers.
K-line charts serve as more than just a collection of numbers; they represent a dynamic portrayal of human feelings reflected in market trends. Each candlestick, with its form, tails, and hue, narrates tales of fear, greed, hope, or despair that unfold across trading platforms globally. These formations capture the shared mindset of investors, showcasing everything from the shock of abrupt sell-offs to the excitement of climbing markets. By understanding these emotional cues, traders can predict changes ahead of time, using market sentiment as a guide for making better and quicker choices. Achieving success in this area relies on interpreting the human experiences behind the statistics, not merely the figures themselves.